The first AI feature is a log you can trust
This is a methods project, not a new device announcement. Imagine that you want to use an AI assistant to describe how conditions changed around a small indoor experiment. Before selecting a model, build a record that lets a person distinguish a real observation from a guess, a gap, or a change in the setup.
A temperature reading alone is a surprisingly incomplete story. You need to know when it was observed, what unit it uses, which device produced it, and whether the collection process was working. If a later chart looks smooth because missing rows were silently filled, an eloquent AI explanation can make that invented continuity sound like a physical event.
The project proposed here is deliberately modest. Use synthetic readings first, then an appropriate documented sensor if you already have one. Keep the output descriptive. Do not connect the exercise to equipment control or use it for a consequential decision. We have not tested a kit, collected a real dataset, or measured a model’s performance for this article.
The useful result is a small data bundle with an honest history. A human should be able to open it, identify missing observations, and understand when the setup changed. Only then ask an AI to summarize patterns. That order makes the project more interesting because you can investigate disagreement instead of merely admiring a fluent answer.
Source: Raspberry Pi: Current operating-system installation guidance ↗ · CanaKit: Raspberry Pi 4 starter-kit variants and parts list ↗ · Python: Time access and monotonic clocks ↗ · Python: CSV reading and writing ↗
Choose a collection machine without confusing it with an AI engine
Raspberry Pi’s documentation describes Raspberry Pi OS as a free operating system installed using Raspberry Pi Imager, with desktop and command-line editions. Its setup guidance is the right place to check the supported installation path for your board. A small Linux computer can collect and store observations without also being responsible for running a large language model.
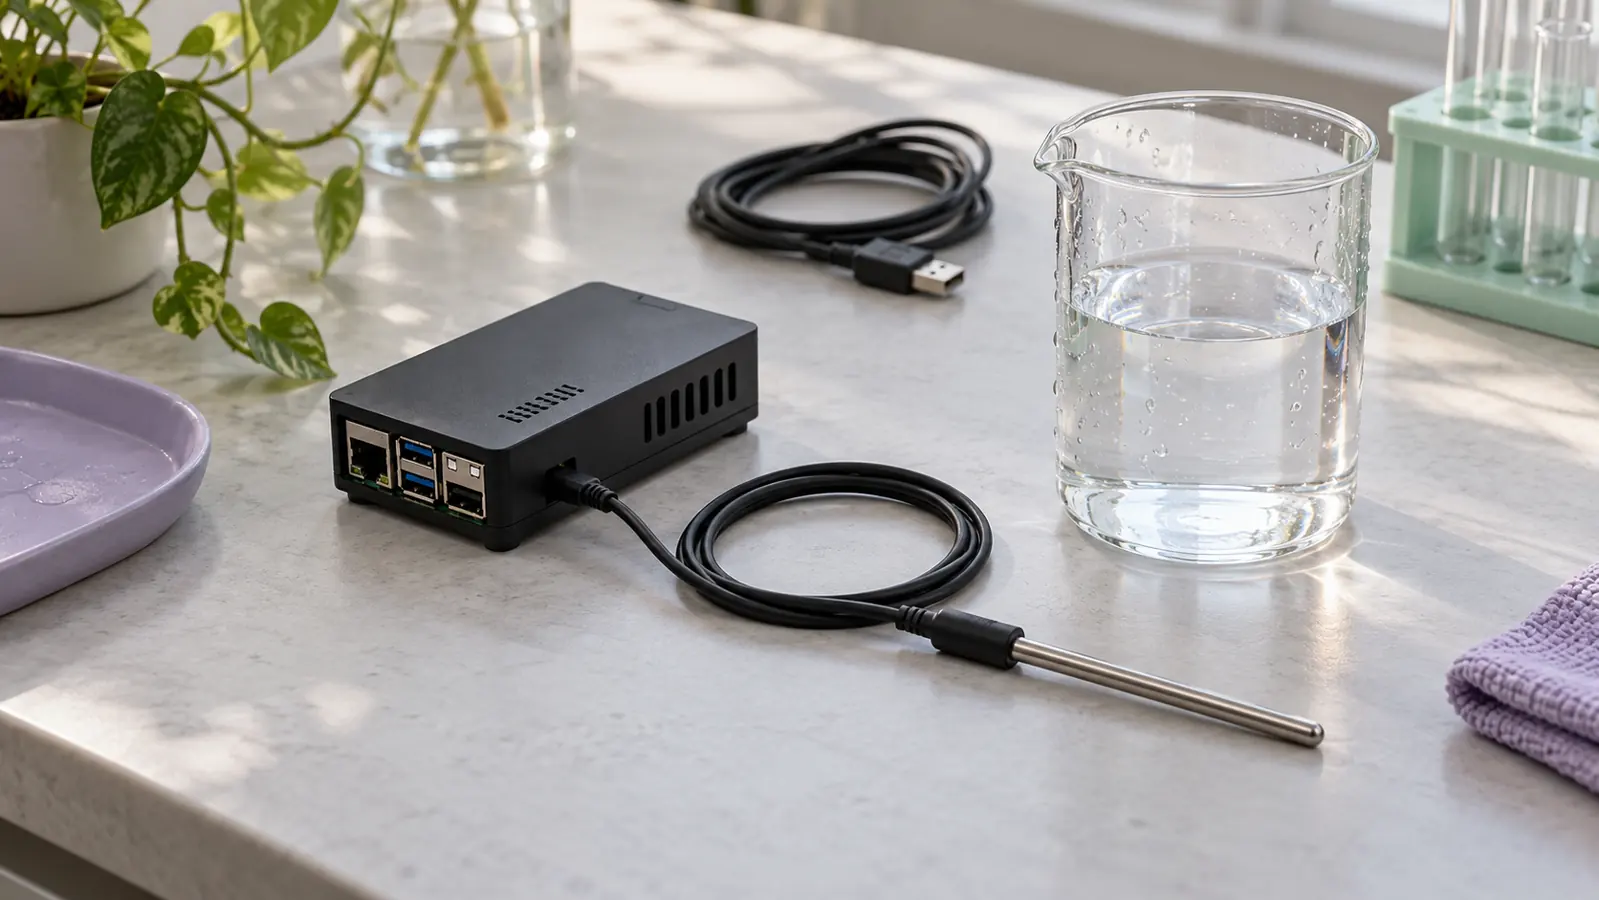
For a dedicated logging machine, the owner-selected CanaKit Raspberry Pi 4 starter kit, 4GB (affiliate link) is one documented hardware option; check the selected bundle against CanaKit’s current parts list and arrange any sensor separately. An existing computer with synthetic readings is enough for this exercise.
As an Amazon Associate I earn from qualifying purchases. This optional recommendation is not a claim of hands-on testing.
CanaKit’s product page lists a Pi 4 board, storage, a power supply, a case, cooling components, and other accessories for its starter-kit variants. Confirm the exact bundle rather than assuming all similarly named kits contain the same parts. Nothing in this project requires you to buy a newer board or treat a kit’s name as evidence of AI performance.
Keep collection and analysis separable. The logger should be able to write a file even if the AI service is unavailable. Later, a person can copy an approved sample into an analysis tool. That design gives you a simple way to inspect what was actually measured before any model rewrites it into a narrative.
If you are working with physical hardware, follow the board and sensor manufacturers’ setup instructions. This article does not provide wiring, power-modification, or component-disassembly steps. The learning goal is the integrity of the record, which you can study without changing any physical connection.
Give every row a meaning and two kinds of time
Design the row format before writing a collection loop. Our suggested fields are a run identifier, a sequence number, an observation timestamp, elapsed time within the run, the value, the unit, a status, and a setup version. These are proposed project conventions. Choose simpler names if you prefer, but write down what each field means.
The run identifier separates one collection session from another. A sequence number lets you notice an omitted row without relying only on the wall clock. The timestamp places an observation on a shared timeline. Elapsed time describes its position within that run. The unit stops a bare number from becoming an ambiguous measurement.
Status should distinguish a valid reading from an attempted reading that failed. A blank value with an explicit error state is more informative than a substituted zero. Zero might be a perfectly possible measurement in some experiments, so using it as a generic failure marker can turn a collection problem into an apparent physical change.
Setup version is your link to a short note about the experiment. If you move the sensor, change a setting, or replace a component, start a new version note. You do not need a complex database. A plain text record with a date, a description, and the affected run identifiers can be enough for a small learning project.
Keep raw observations unchanged. If you later correct a unit label or create a derived value, save the transformation separately and describe it. The raw file should remain a record of what the collection process produced, including the awkward parts you would rather have missed.
Calendar time and elapsed time answer different questions. A timestamp helps you connect an observation with an external note: when a window was opened, for example. An elapsed-time counter helps you inspect the spacing within one collection run. Record both if that distinction matters to your project.
Python’s time documentation describes monotonic clocks as clocks that do not move backward because of a system-clock update. That makes them useful for elapsed intervals. Their reference point is not a calendar date, so do not treat a monotonic value as something you can compare directly across unrelated machines or sessions.
In the proposed log, store an explicit timezone with calendar timestamps, or use a consistently documented UTC format. Keep local display formatting for a later view. This reduces confusion when a file is shared with someone in another timezone or when local clock rules change.
Now create a synthetic test where the displayed calendar clock changes while the sequence numbers keep increasing. Ask whether your reader can still reconstruct the order of observations. This is a data-format exercise, not a claim that your board will experience a particular clock issue.
Also test what happens when the collection loop is late. A target interval is a plan; the actual observation time is evidence. If your software records the planned time rather than the observed time, a later chart may conceal the delay. Preserve the distinction in the file and let the analysis decide how to handle it.
Make missing samples visible and test the file
Create twenty synthetic rows at a documented interval. Then deliberately omit one row, mark another as a failed reading, and repeat a sequence number in a separate copy. These invented defects give you something concrete to detect. They are not measurements from real hardware.
Write simple checks before involving an AI. Are sequence numbers unique within the run? Do they increase as expected? Are units consistent? Does every row marked valid contain a value in the format you intended? Can the file distinguish an omitted row from an explicit failed attempt? A spreadsheet is enough for an early pass.
Do not silently interpolate while preparing the raw view. A connecting line can make two observations appear continuous across a gap. If you create an interpolated view later, label it as derived and retain the original missing interval. Your AI prompt should identify which file contains observations and which contains estimates.
Keep a small count summary beside the dataset: attempted observations, valid readings, explicit failures, and suspected omissions. The categories should follow your format’s definitions. If you cannot determine the number of attempted readings, say so rather than manufacturing a complete total from the rows that survived.
Then ask the AI to describe the data’s limitations before its trends. A useful first response should identify the missing interval and the failed reading. If it immediately explains the apparent temperature change without noticing either, you have discovered a problem with the analysis workflow before trusting its conclusions.
Python’s csv documentation provides readers and writers for tabular files, including dictionary-based variants. It also documents newline handling and the fact that ordinary reading does not automatically convert every field into a numeric type. Those details matter when a file moves between a script, a spreadsheet, and an analysis tool.
Use a standard writer rather than assembling rows by joining text with commas. Then read the saved file back with a standard reader and compare the fields you care about. This is a small round-trip check: did the format preserve the record you intended to store?
Include one note containing punctuation, such as a comma, in the synthetic data. Include an empty measurement with a failure status. Make sure the reader sees the same field boundaries and missing-value meaning. These cases are more instructive than a file containing only neat numbers that never challenge your assumptions.
Keep conversion explicit. If the analysis expects a numeric value, define what happens when the field is empty or invalid. Do not let an AI-generated script quietly replace an unparseable entry with zero or discard the row without a report. Ask it to summarize any rows excluded from a calculation.
You can have an assistant help write the checker, but inspect its behavior on the deliberately damaged file. The exercise has a known answer: you inserted the defects. That gives you a way to evaluate the code without accepting a confident explanation as proof that the checker works.
A moved sensor is a changed experiment
Suppose your hypothetical sensor sits near a window for the first run and near a computer for the second. A difference in the recorded values might be related to the changed placement. Without a setup note, a model could describe it as a change in the room as a whole. That would go beyond what the observations establish.
Record the scope of the measurement in ordinary words. “Sensor on the shelf near the window” is more useful than an unexplained location code. You do not need to disclose a precise address. The point is to preserve the experimental context that affects interpretation, not to collect unnecessary personal information.
When you change placement, mark the transition. Do not combine the runs as though the conditions were identical. You can compare them, but the comparison should name the changed setup. That gives the AI a chance to discuss alternative explanations instead of inventing a single cause.
Keep an event note separately from the sensor values. If you opened a window, write that observation with its own timestamp and uncertainty. An event note is not the same kind of evidence as a sensor reading. Joining them later should preserve that distinction.
Ask the assistant to use conditional language appropriately: the pattern is consistent with a possible explanation, but the log alone may not establish the cause. This is not a request for vague hedging everywhere. It is a request to match the strength of the explanation to what the experiment actually records.
Give the AI a bounded analysis job
Once the checks pass, provide a small approved dataset and its data dictionary. Ask for three outputs: a description of observed changes, a list of data-quality limitations, and questions that would require another observation. Specify that missing readings must remain missing and that the model should not infer a cause from timing alone.
Require the answer to point to run identifiers and intervals. A statement such as “values rose during the second half of run A” can be checked against the file. A broad claim that “the environment became unstable” is harder to evaluate unless the project has defined that term.
Have the assistant separate arithmetic from explanation. It can propose a calculation or write code to perform it, but a number should be labeled as computed only when the calculation was actually executed and checked. If the tool cannot execute code, preserve that limitation and perform the arithmetic elsewhere.
Now remove the setup notes and repeat the analysis as a comparison exercise. Do not use the less-informed answer for a real decision. Examine what changed: did the assistant become more confident, miss a placement change, or ask for context? This shows how much the narrative depends on information outside the value column.
Keep the raw files local when possible and share only what the exercise requires. Even a simple log can become more revealing when paired with detailed personal event notes. Collecting less unrelated context makes the project easier to understand and easier to share responsibly.
Finish with a dataset someone else can question
Package the raw rows, a short data dictionary, setup notes, and the checker’s report. Add the analysis separately, labeled with the tool and date. A reader should be able to disagree with the explanation without losing access to the observations that prompted it.
Your first successful result might be finding a missing reading before a model invents a story about it. That is a worthwhile outcome. It means the project’s evidence is becoming more inspectable, which is a better foundation for later AI work than a polished dashboard built on ambiguous rows.
If you later add forecasting, anomaly detection, or an interactive display, keep the same distinction between observation and interpretation. The model can change. The record should still explain where its inputs came from.
Start with twenty synthetic rows and three deliberate defects. Make those defects visible to a human, then see whether an AI analysis respects them. That small exercise teaches a practical skill you can carry into much larger data projects.
Try this, then make it yours.
Create twenty synthetic readings, insert one omission, one explicit failure and one duplicate sequence number, then check whether both your script and AI analysis identify them.
Follow the signal.
Our reporting starts here. Practical suggestions are our analysis, and vendor performance statements are claims unless independently verified. We haven’t hands-on tested this release.
- Raspberry Pi: Current operating-system installation guidance ↗
- CanaKit: Raspberry Pi 4 starter-kit variants and parts list ↗
- Python: Time access and monotonic clocks ↗
- Python: CSV reading and writing ↗