A reusable representation of the planet
Ai2's October 22 OlmoEarth v1.3 release pairs a satellite embedding model with precomputed annual data and a browser-based Embeddings Explorer. Instead of starting every question by running a large model over imagery, users can explore representations already computed from it.
The release describes 10-meter embeddings with 64- and 128-dimensional options. Its explorer supports finding similar places, working with labeled examples, comparing years, and checking underlying imagery. Ai2 reports strong results on its evaluations; Signal Scroll has not reproduced those results or tested the explorer's mapping accuracy.
One launch detail deserves attention: the announcement says 2023–2025 coverage is global, while 2017–2022 coverage is limited to selected countries. A nine-year example in one region should not become a claim that every place has the same historical archive.
The useful beginner question is not whether the map looks impressive. It is what kind of observation you can reasonably make with it. This methods article proposes a small exploration of an ordinary public landscape. It is not a finding about a particular neighborhood, an environmental investigation, or a claim that a map reveals why a change occurred.
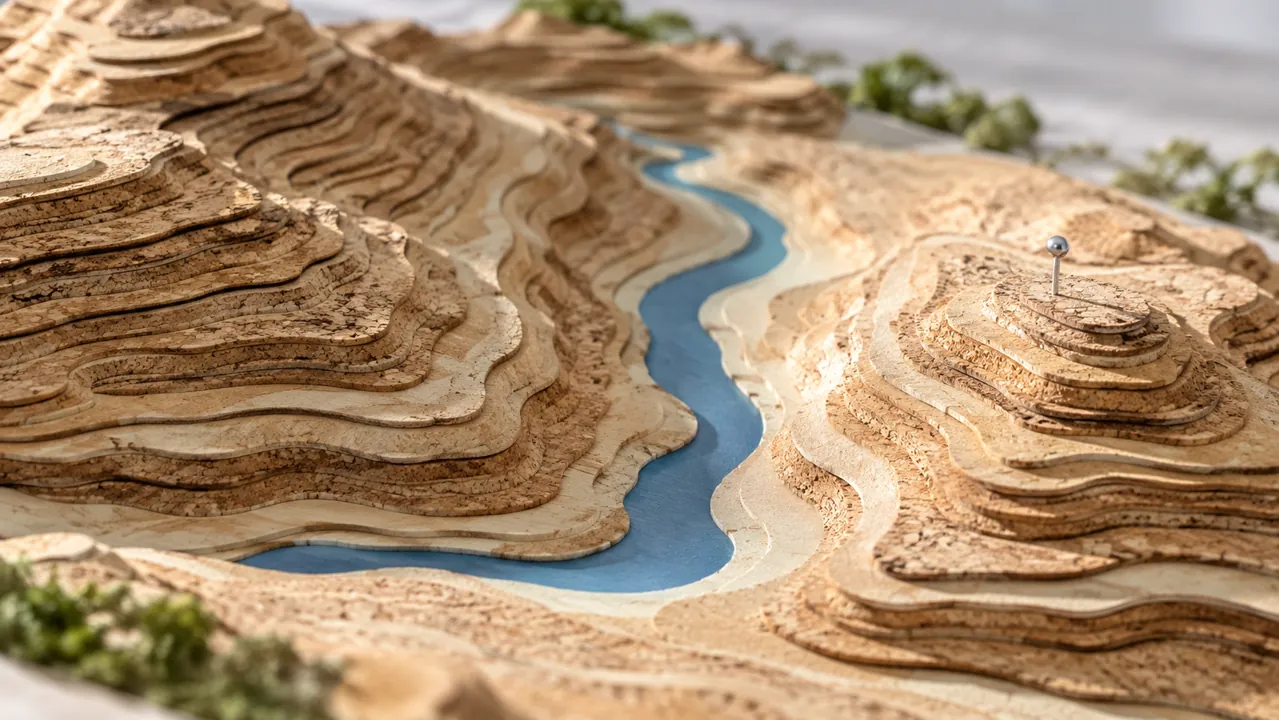
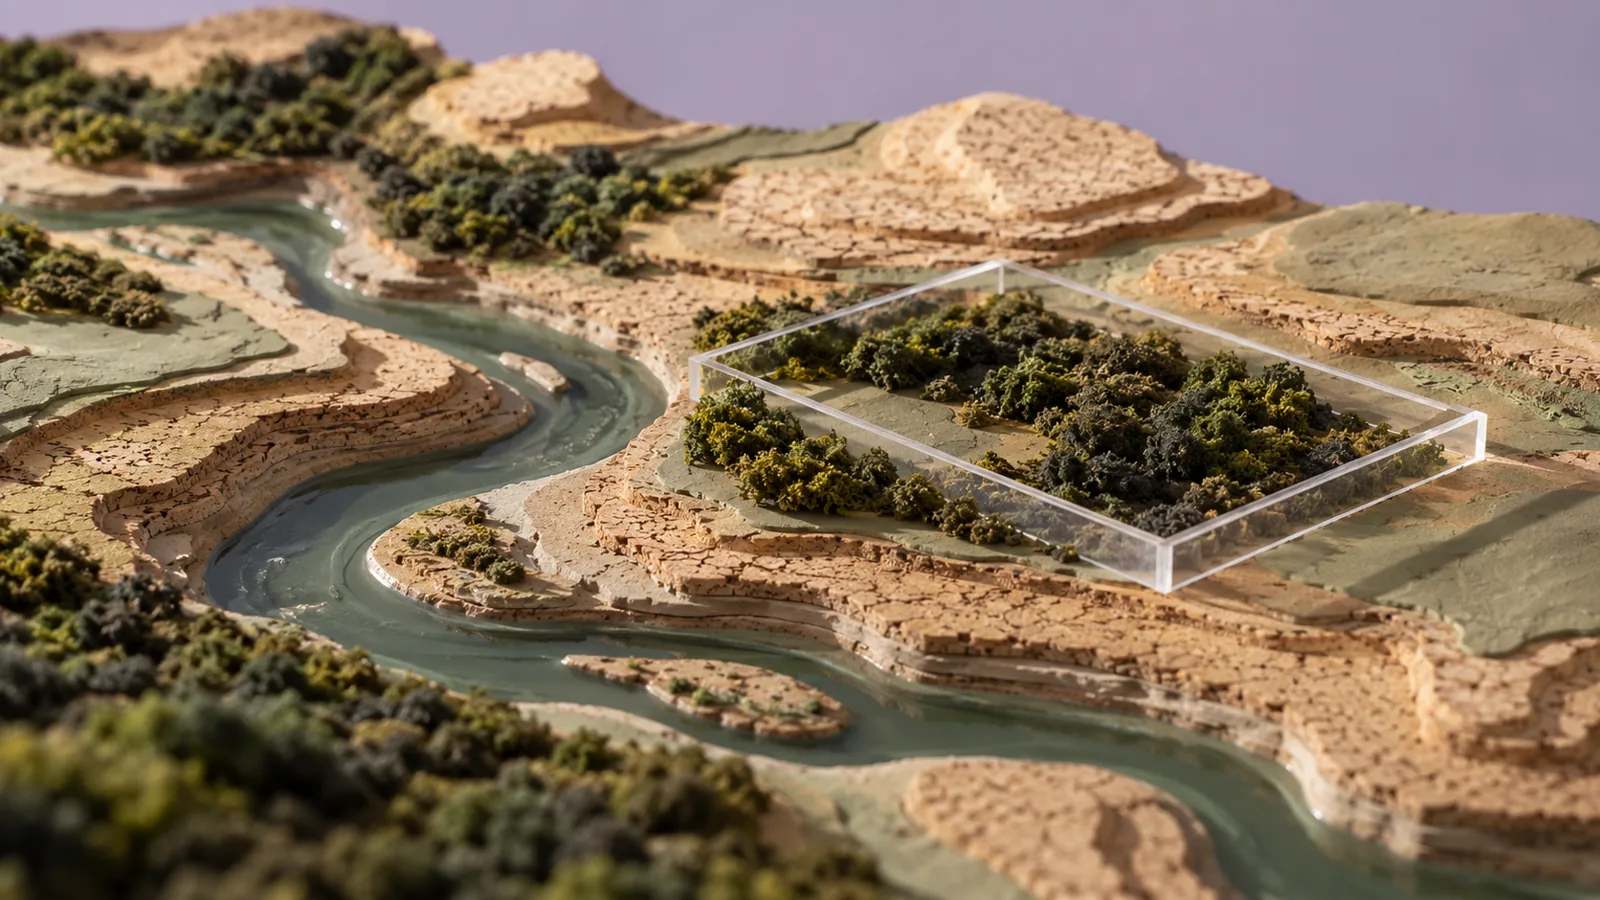
Imagine you are curious about a river corridor and the different kinds of land around it. You want to compare patches that appear similar, then understand where the comparison breaks down. That is a good learning goal because it gives you something specific to inspect without requiring you to turn a colorful output into a consequential judgment about people or property.
Source: Ai2: OlmoEarth v1.3 release and Embeddings Explorer ↗ · Ai2: OlmoEarth v1.3 technical report ↗ · Ai2 on Source Cooperative: OlmoEarth v1.3 embeddings and provenance ↗ · Ai2: OlmoEarth code and evaluation materials ↗
Understand the numbers without pretending to decode them
An embedding is a numerical representation. In this case, the technical report describes condensing information across satellite modalities and time into a compact vector. The individual numbers are not a legend of human-readable land categories. You should not assume one dimension means forest or another means pollution.
For a useful analogy, imagine sorting songs by a numerical description of their sound. Songs close together in that representation may share useful patterns, but the representation does not tell you whether you personally like them. The analogy is ours, and it is deliberately limited: satellite mapping has its own data, objectives, and evaluation problems.
The same distinction applies to a landscape search. A similar representation is a lead to inspect. It does not automatically establish that two places share the property you care about. You supply the intended meaning of similar, then evaluate whether the results serve that meaning.
Write that meaning before clicking. In our proposed river exercise, you might want broad patches that resemble a known vegetated riverbank, rather than places with the same legal designation or habitat quality. The latter claims require other evidence. Keep the target within what the exercise can reasonably explore.
A false-color visualization also needs interpretation. Attractive color boundaries can make categories feel more definite than your question warrants. Ask what the displayed colors encode and avoid inventing a semantic label merely because a patch looks distinct.
The practical outcome is a better search habit. Use the representation to narrow attention, then check what the candidates actually show. This is more useful than trying to assign a story to every color on the map. The numbers help organize a question; they do not remove the need to ask one.
Make a small comparison with a clear geographic boundary
For the first session, choose a public area large enough to contain several visible land patterns but small enough to inspect carefully. Record the geographic boundary and the year you are viewing. If you are learning with an unfamiliar place, state that limitation in your notes.
Pick one reference patch and explain why it interests you. In the hypothetical river exercise, perhaps it appears to contain vegetation alongside water. Avoid defining it as healthy habitat unless you have appropriate independent evidence. Your initial label should describe the observation you can support.
Now consider a few candidate matches. For each, write what appears similar and what appears different in the underlying imagery. You are building an interpretation log, not collecting proof that the model understands an entire ecosystem.
Include an awkward candidate. A result that partly matches your reference can teach more than the most obvious hit. Does the candidate share water proximity but differ in surrounding land? Does a boundary cut through mixed surfaces? What additional view or source would resolve your uncertainty?
Keep your notes independent of the search order. A high-ranked result is not automatically a confirmed example. A lower-ranked result is not necessarily useless. Your intended task determines which differences matter.
Do not expand the geographic claim after seeing a few promising patches. If you inspected a small corridor, say so. If the exercise only used one reference, say that too. A modest comparison is a useful result when its scope is clear. It gives you a basis for a better second question without pretending you have surveyed an entire region.
Separate change detection from the story of the change
A comparison across years can reveal a pattern worth investigating. It cannot, by itself, establish the cause of that pattern. In our proposed exercise, a changed representation could prompt you to inspect imagery and consult other sources. It should not immediately become a claim about who acted or what happened.
Write the observation before the explanation. The selected patch differs between these annual views is one kind of statement. A specific construction project caused the difference is another. Keep the second statement provisional until you have suitable corroboration.
The annual nature of the released embeddings also matters. Do not label an annual comparison as a live feed. If you need to answer what happened last Tuesday, first establish whether the data and method can address that time scale. A tool that is useful for broad historical comparison may not answer a precise event question.
For a learning notebook, make two columns: possible explanations and evidence needed. You might list a land-cover change, seasonal differences in the inputs, or an interpretation mistake as possibilities to investigate. These are hypothetical alternatives, not findings about OlmoEarth's behavior in a tested location.
Then prioritize the cheapest useful check. Inspect the underlying imagery. Confirm the selected years. Check whether the area is covered consistently. If the question becomes consequential, seek appropriate domain expertise and stronger evidence before publishing a conclusion.
A compelling map story can keep this uncertainty visible. Show the reader the observation, the competing explanations, and the next source you would consult. That is often more educational than attaching a confident cause to a bright patch and leaving the reasoning off the page.
Choose labels that another person could apply
The explorer's labeled-example workflow invites a useful design question: what exactly is the category you are teaching the small classifier? A label such as interesting land is too vague for another person to reproduce. Even a familiar term can hide disagreement about boundaries.
For the river example, create a written labeling rule based on what you can observe in the available material. Define which patches count, which do not, and which remain uncertain. Do not silently turn a visual category into an ecological or legal assessment.
Ask a second reader to label a handful of the same locations independently. Compare disagreements before adding many more examples. If you disagree because the rule is ambiguous, revise the rule. If the imagery is insufficient, keep an uncertain category rather than forcing a confident label.
Reserve a few locations for checking the result after you have chosen labels. Avoid judging the map only at the points you used to build it. A learning exercise should give your method a chance to encounter something it did not already see during setup.
Also include nearby lookalikes. A category defined only by easy positive examples may fail at the boundary you actually care about. The useful question is which differences the method can distinguish in this setting, not whether the easiest patch receives the expected color.
None of this is a claim that we trained or evaluated an OlmoEarth classifier ourselves. It is a proposed way to make a small experiment interpretable. If the resulting map is poor, your notes should help distinguish unclear labels, unsuitable evidence, and a method that does not serve the chosen task.
Trace the picture back to its inputs
The released data documentation provides a route to provenance: information about where the representations came from. Ai2 describes per-tile, per-year tables listing source satellite scenes. That is a useful complement to the explorer because a representation is easier to assess when you can identify its inputs.
For your notebook, record the source location or tile, the year, the data version, and the documentation link. If you cannot find a provenance field you need, mark it missing. Do not substitute a plausible acquisition date based on the year label.
Keep the exported map separate from your interpretation. A file can preserve predicted classes or numerical values without preserving the explanation of how you chose labels. Save the labeling rule, reference points, and limitations alongside it.
When preparing a screenshot for a presentation, keep the extent and time period visible in the accompanying caption. If you crop away the interface, add those details in your own words. A striking image without its boundaries is easy to reuse as evidence for a different claim.
Also consider who could be affected by your interpretation. Broad land patterns should not become unsupported assertions about an individual household, business, or community. This is an editorial boundary for the proposed exercise, not a claim that the tool identifies any person.
The technical report and repository are useful next stops when a question outgrows casual exploration. They document methods and evaluation materials that a screenshot cannot convey. You do not need to reproduce the whole system to learn from it, but you should know when your claim requires more than the view you currently have.
Turn the exploration into an honest map story
A strong final result for the proposed river exercise might be a short page showing one reference patch, several candidates, and a paragraph explaining which similarities were useful. It might also show one place where the comparison failed. That failure is part of the learning, not an image to hide.
Open with the question. Explain the selected region and years. Describe the model output narrowly. Then separate your interpretation and the evidence you would need for a stronger conclusion. Readers should be able to tell which parts come from the release documentation and which parts are your own analysis.
Avoid claiming that the tool discovered something simply because you had not noticed it before. Discovery is a stronger word than useful exploration. If you found an unfamiliar pattern, say that and identify the follow-up work.
Your next session can change one thing deliberately. Perhaps you choose a different reference, clarify a label, or investigate a different year. Keep the earlier note so you can see whether the new question changed the result. Do not keep clicking until a map happens to fit the story you wanted.
The release's important practical shift is access to reusable representations and an approachable way to explore them. The benefit for a learner is the opportunity to ask better spatial questions without first building a large processing pipeline.
You should finish with a clearer distinction between resemblance, classification, change, and cause. Those words describe different claims. OlmoEarth can help you explore the first steps, while your evidence and judgment determine how far the story goes. A map becomes more useful when its reader understands both what it reveals and what remains to be checked.
Try this, then make it yours.
Choose one public landscape and one supported year. Record a narrow visual question, inspect a reference patch and several similar candidates, and write down one useful match, one mismatch, and the evidence needed to interpret them.
Explore the tool ↗Follow the signal.
Our reporting starts here. Practical suggestions are our analysis, and vendor performance statements are claims unless independently verified. We haven’t hands-on tested this release.
- Ai2: OlmoEarth v1.3 release and Embeddings Explorer ↗ · 2026-10-22
- Ai2: OlmoEarth v1.3 technical report ↗
- Ai2 on Source Cooperative: OlmoEarth v1.3 embeddings and provenance ↗
- Ai2: OlmoEarth code and evaluation materials ↗